
Back to resource library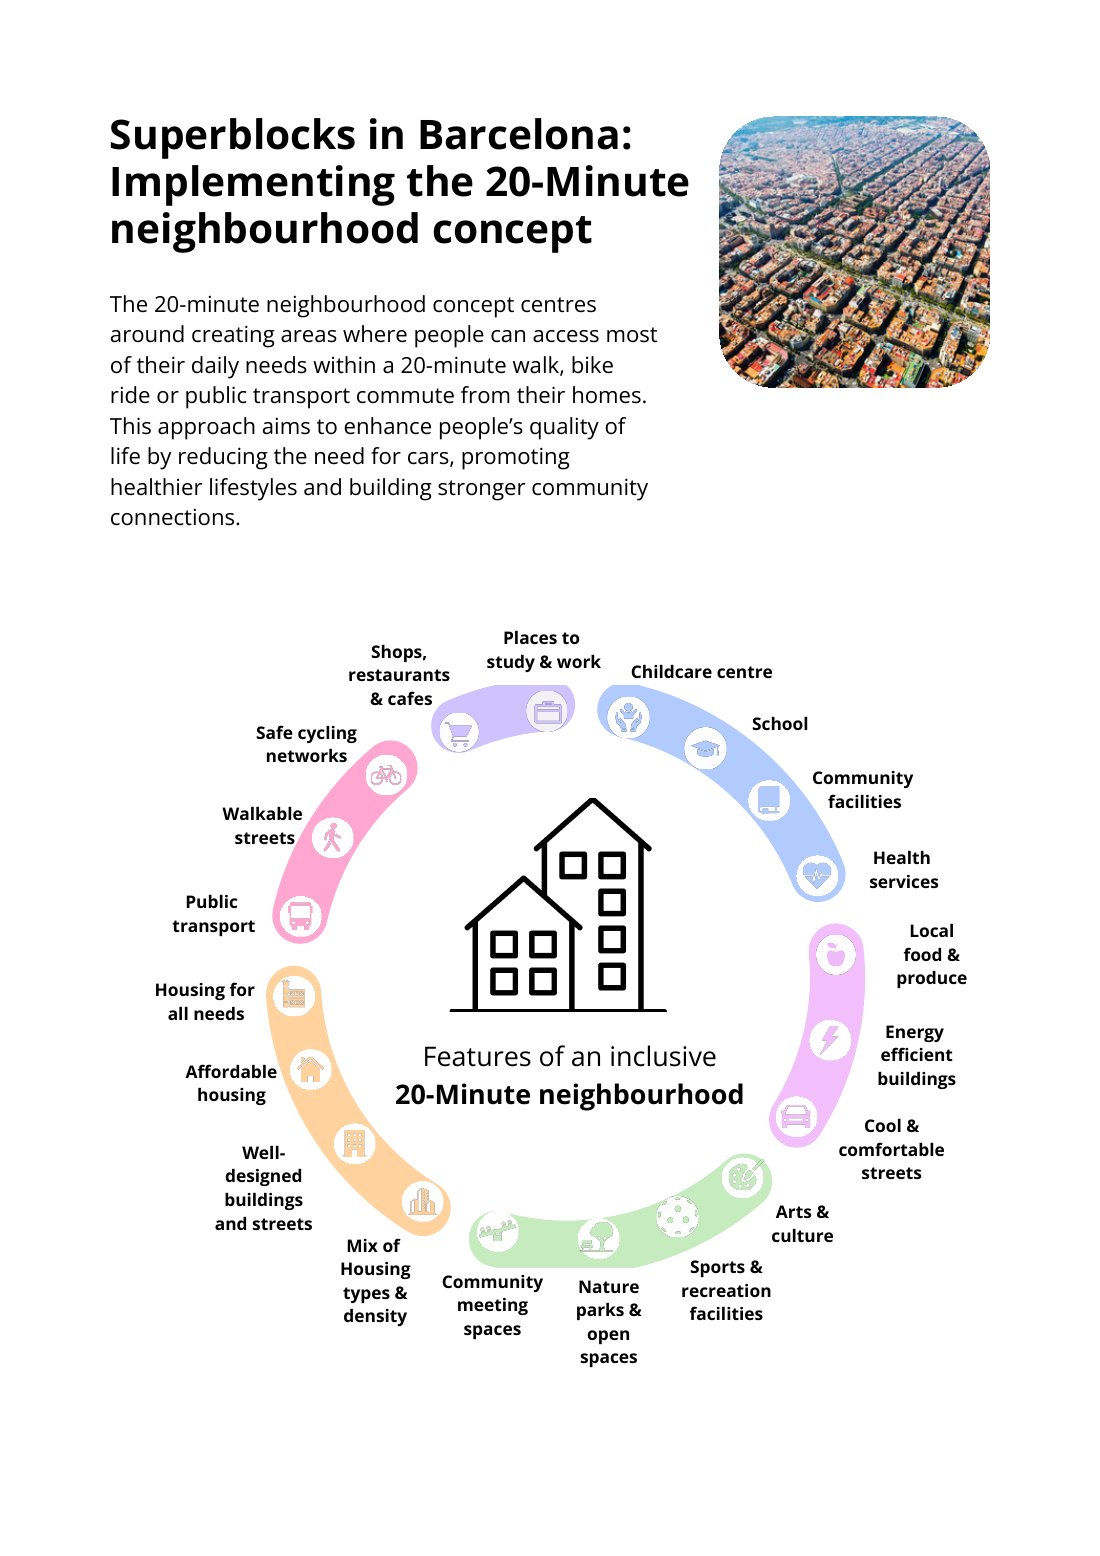
Showing first page only

Designed by
The Team from CoolPlus
Infographic
Liveability and Sustainable Communities Superblocks Neighbourhood Educational Infographic
Geography 7-10 · Infographic
Year 7Community EngagementEthical Understanding
This engaging infographic for Year 7 Geography students explores Superblocks and their impact on liveability and sustainable communities. Students will analyze the distribution of services and facilities, understanding implications for urban planning and social equity. Perfect for case studies and classroom discussions on accessibility and fairness.
Curriculum link
the location and distribution of services and facilities, and implications for liveability of places (AC9HG7K06)