
Back to resource library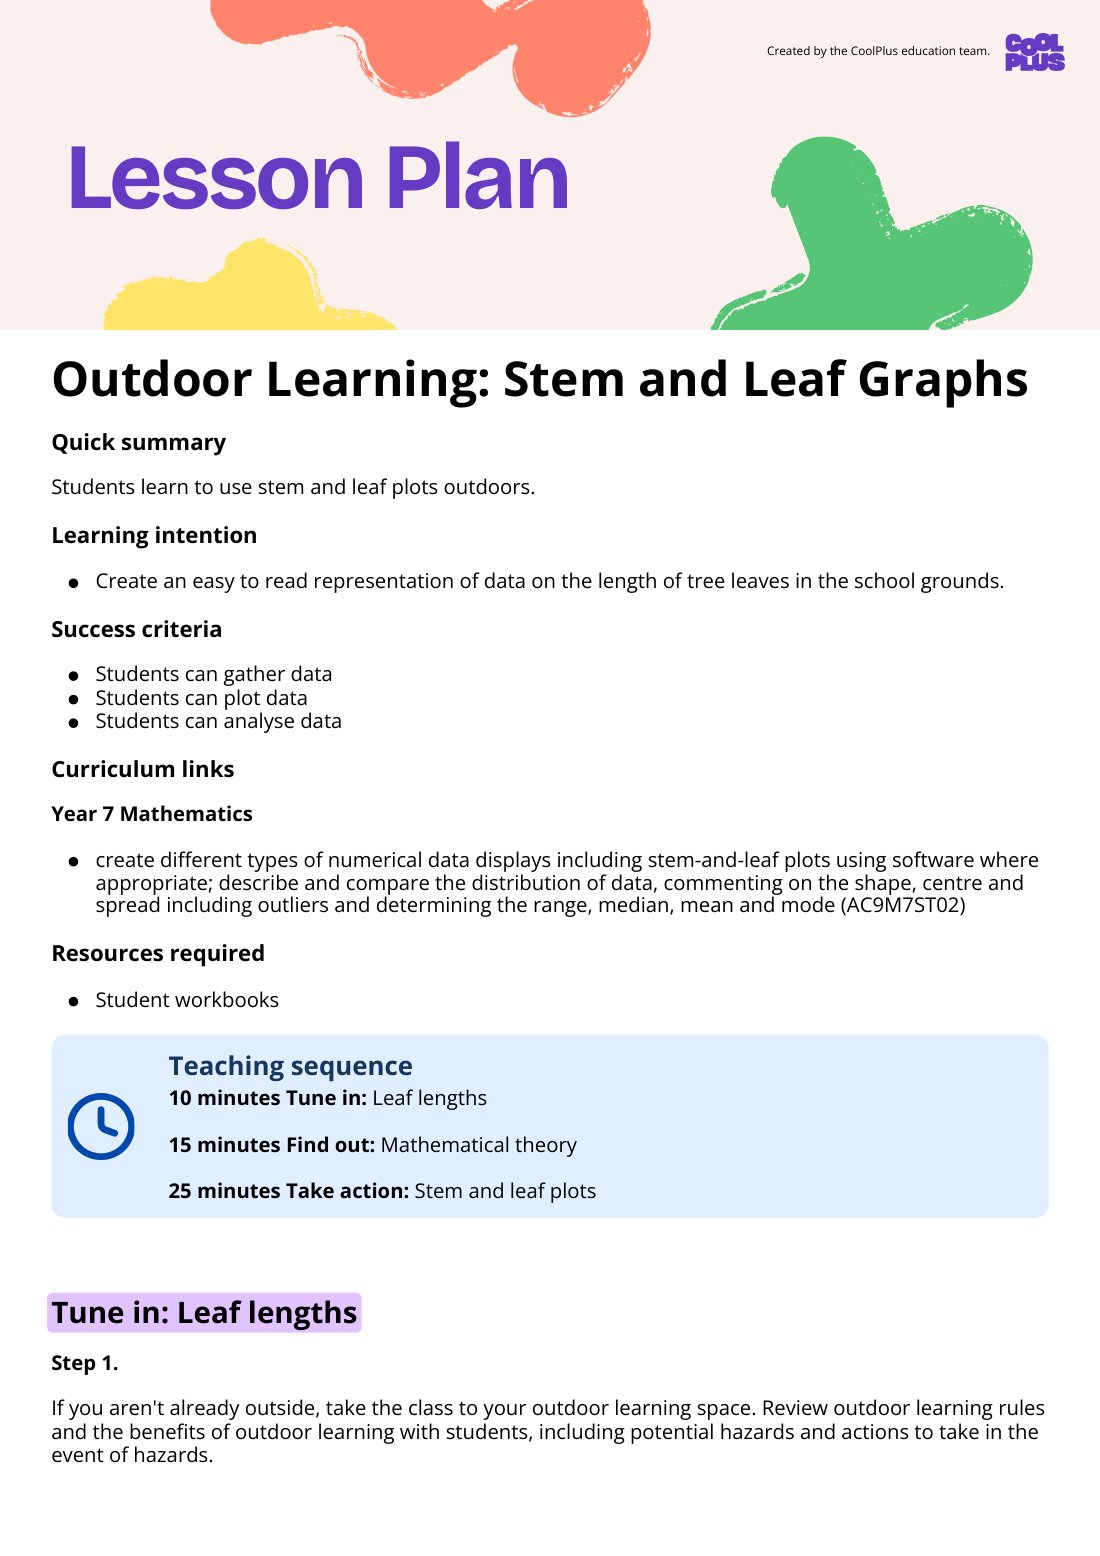
Showing first page only

Designed by
The Team from CoolPlus
Lesson
Outdoor Learning: Stem and Leaf Graphs Lesson Plan
Mathematics · Lesson Plan
Year 7DataGraphs
This Year 7 Mathematics lesson plan brings statistics to life with outdoor learning. Students collect real-world data, construct stem-and-leaf plots, and analyze distribution, shape, center, and spread, including mean, median, mode, and range.
Curriculum link
create different types of numerical data displays including stem-and-leaf plots using software where appropriate; describe and compare the distribution of data, commenting on the shape, centre and spread including outliers and determining the range, median, mean and mode (AC9M7ST02)