
Back to resource library
 Slide 2
 Slide 3
 Slide 4
 Slide 5
 Slide 6
 Slide 7
 Slide 8
 Slide 9
Slide 1 of 9
Features of Graphs Education Presentation
8 more slides in this deck
Slide 2Slide 3Slide 4Slide 5Slide 6Slide 7Slide 8Slide 9
Designed by
The Team from CoolPlus
Presentation
Features of Graphs Education Presentation
Mathematics · Presentation
Year 7DataGraphs
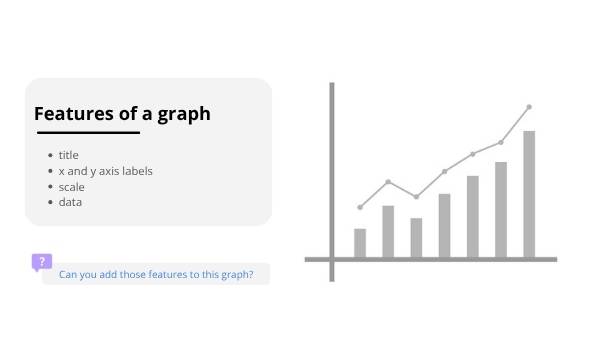
This presentation unpacks essential graph features like axes, labels, and scales. Students will learn to interpret line and bar graphs, fostering critical thinking and problem-solving skills. Perfect for Year 7 Mathematics, aligning with AC9M7A04 on describing relationships in graphs from authentic data.
Curriculum link
describe relationships between variables represented in graphs of functions from authentic data (AC9M7A04)