
Back to resource library
 Slide 2
 Slide 3
 Slide 4
 Slide 5
 Slide 6
 Slide 7
 Slide 8
 Slide 9
Slide 1 of 9
Graphs Measuring Rates of Water Flow Education Presentation
8 more slides in this deck
Slide 2Slide 3Slide 4Slide 5Slide 6Slide 7Slide 8Slide 9
Designed by
The Team from CoolPlus
Presentation
Graphs Measuring Rates of Water Flow Education Presentation
Mathematics · Presentation
Year 7DataGraphs
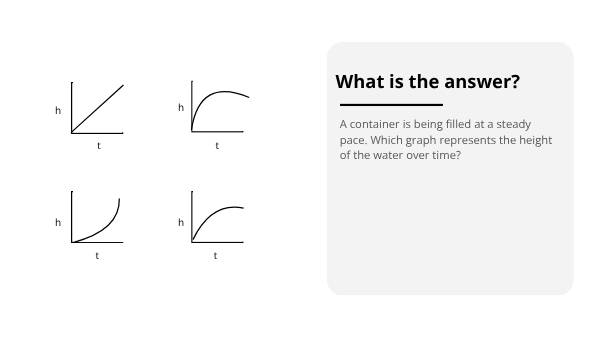
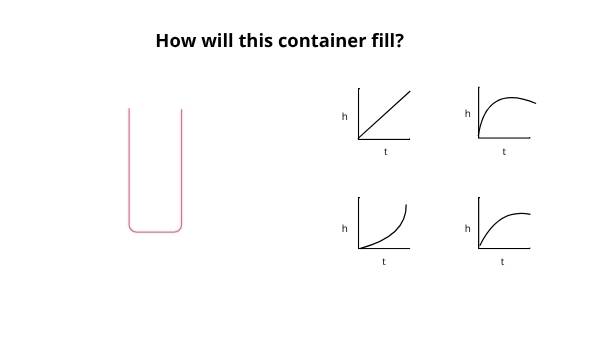
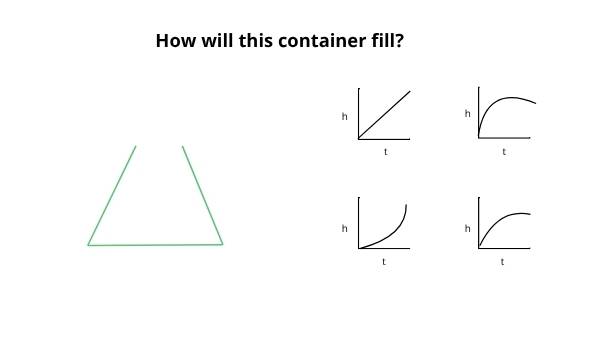
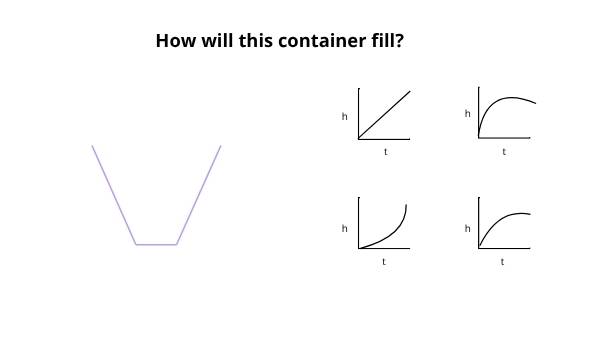
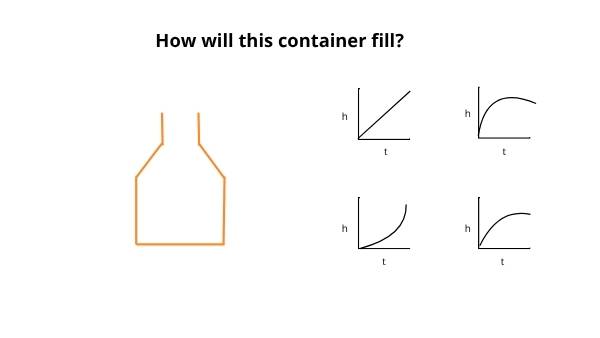
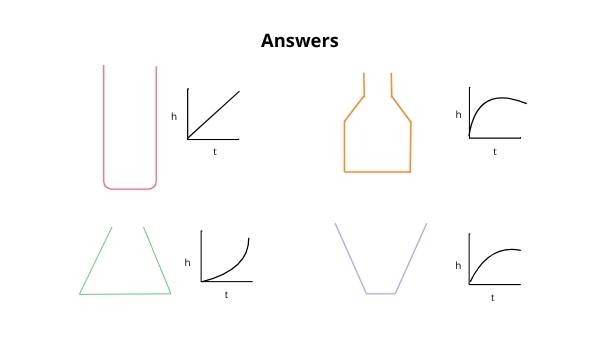
This Year 7 Mathematics presentation uses authentic data to teach algebra concepts by graphing water flow rates. Students will describe relationships between variables, fostering understanding of sustainability and data analysis in a practical context.
Curriculum link
describe relationships between variables represented in graphs of functions from authentic data (AC9M7A04)