
Back to resource library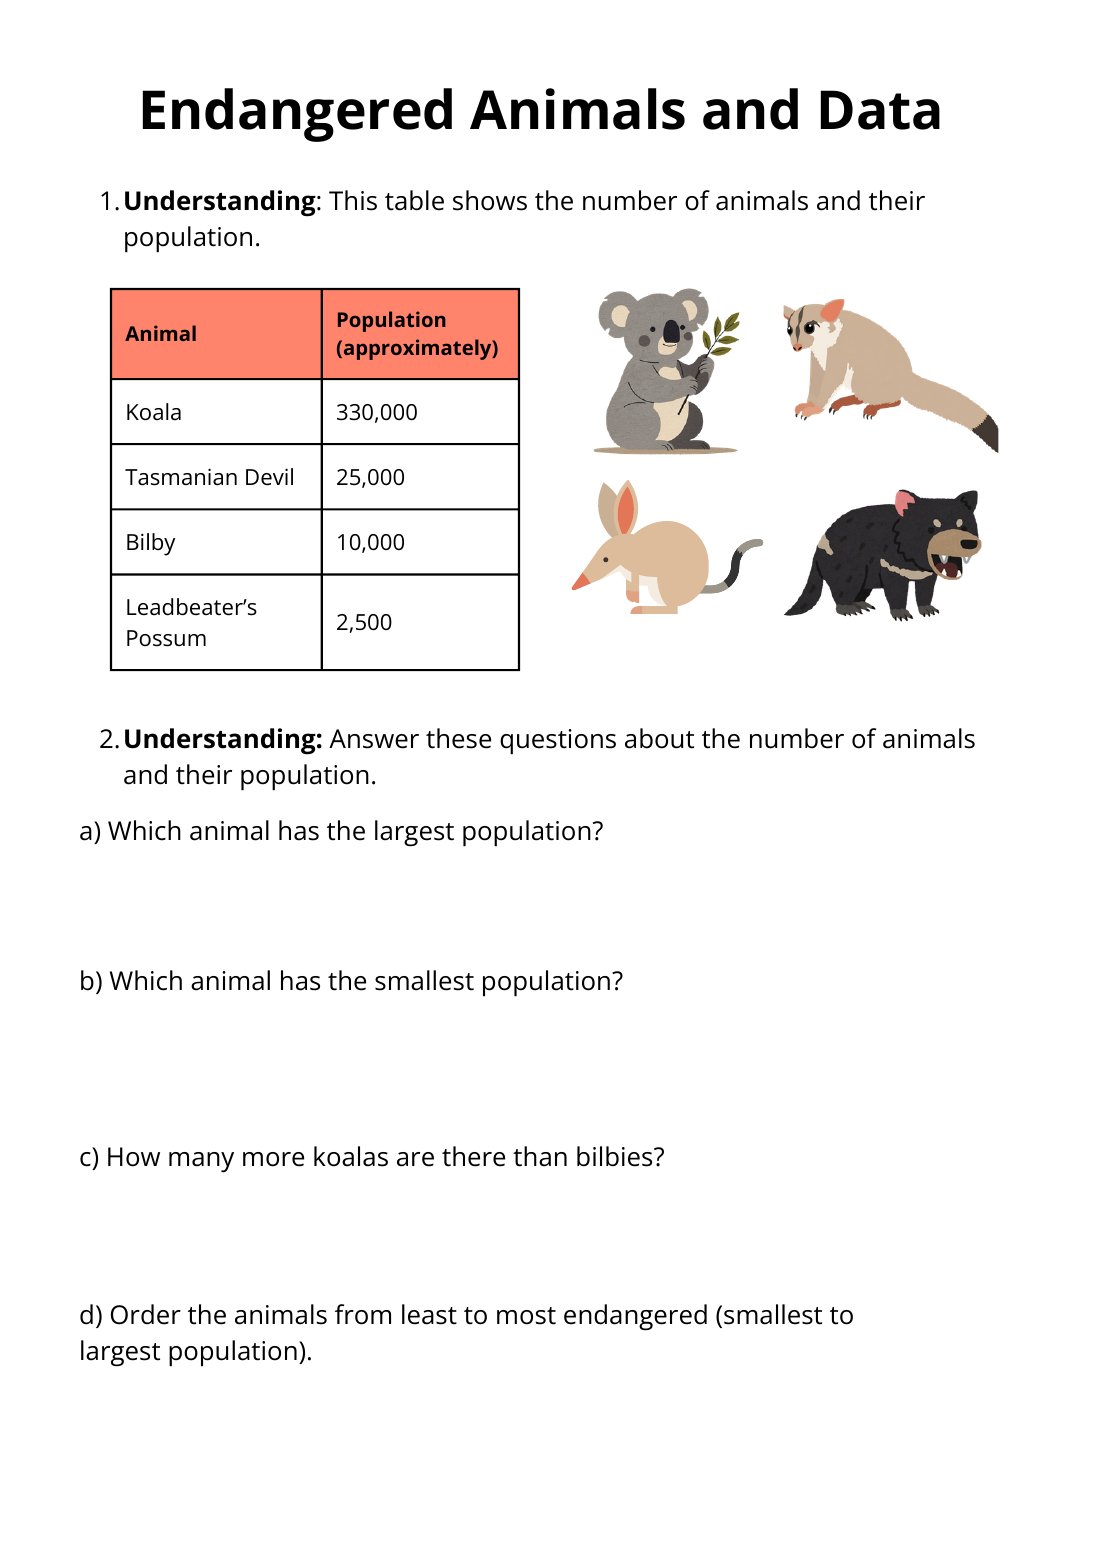
Showing first page only

Designed by
The Team from CoolPlus
Worksheet
Endangered Animals & Data Worksheet
Mathematics · Worksheet
Year 5DataGraphs
Engage Year 4 students with this Mathematics worksheet focusing on Statistics. Students will acquire, represent, and interpret data on endangered animals using pictographs and column graphs, fostering data analysis and critical thinking skills. Perfect for classroom application.
Curriculum link
acquire data for categorical and discrete numerical variables to address a question of interest or purpose, using digital tools; represent data using many-to-one pictographs, column graphs and other displays or visualisations; interpret and discuss the information that has been created (AC9M4ST01)