
Back to resource library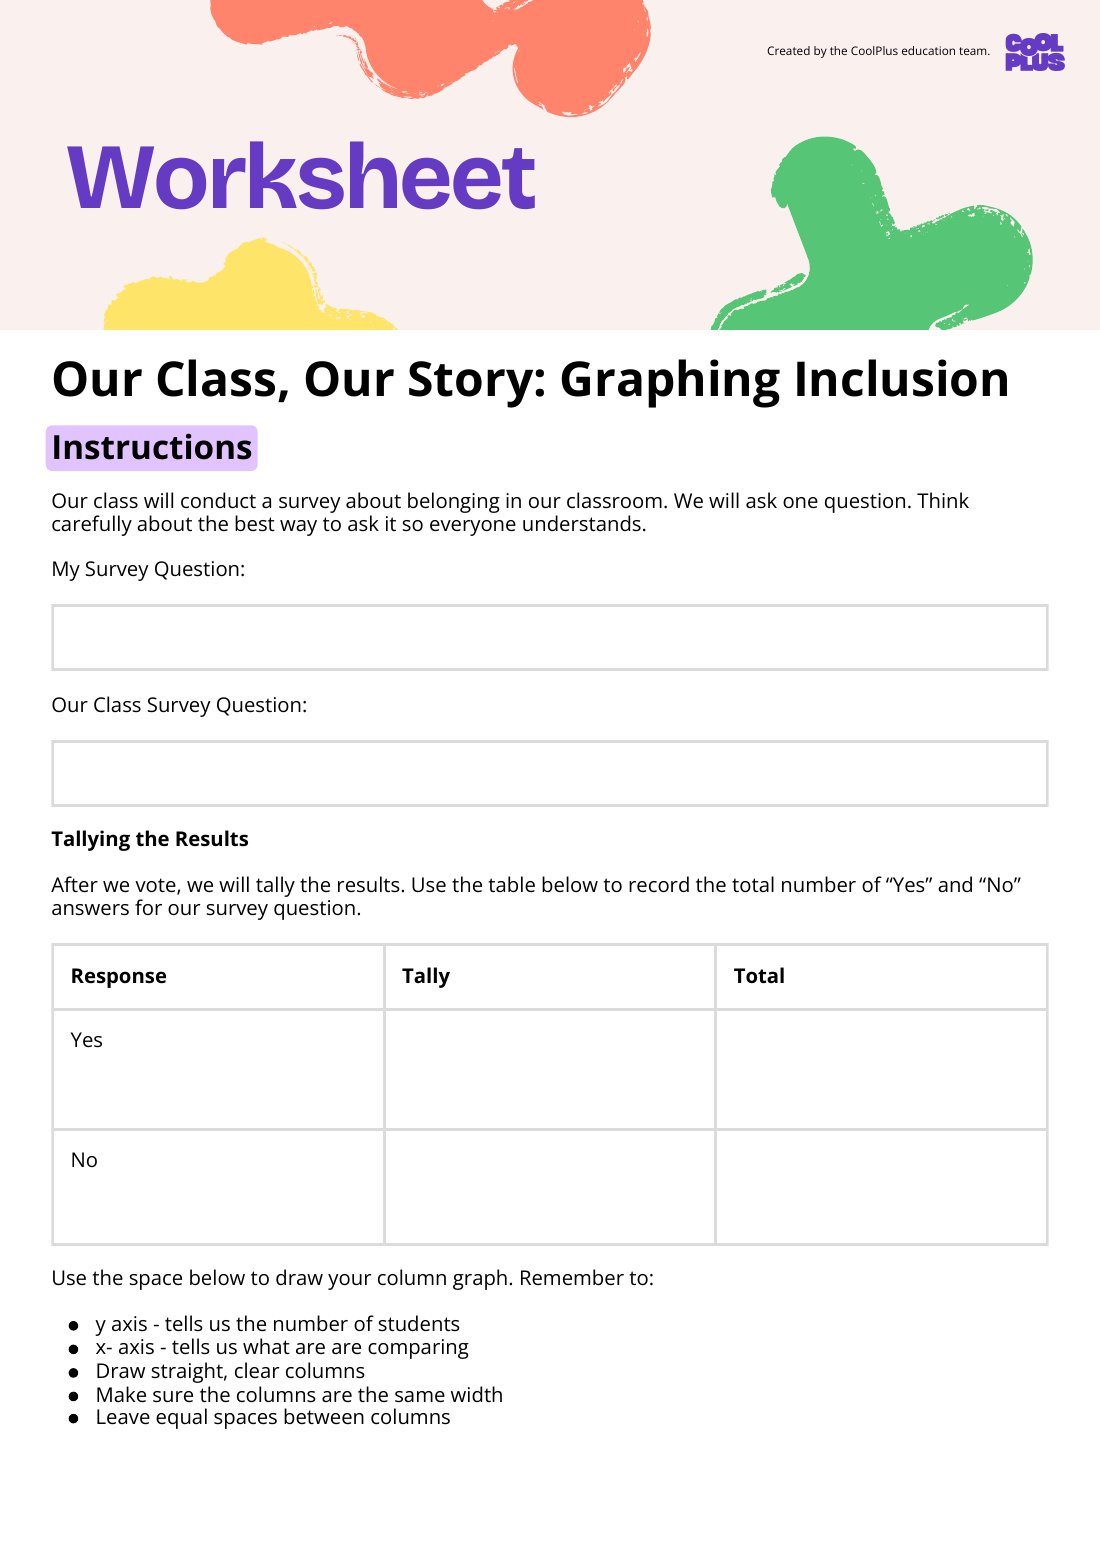
Showing first page only

Designed by
The Team from CoolPlus
Worksheet
Our Class, Our Story: Graphing Inclusion Worksheet
Mathematics · Worksheet
Year 5CollaborationDataHarmony Week
This Year 4 worksheet fosters inclusion and belonging through data collection and graphing. Students conduct surveys, represent categorical data using column graphs or pictographs, and interpret results, aligning with AC9M4ST03 for statistical investigations.
Curriculum link
conduct statistical investigations, collecting data through survey responses and other methods; record and display data using digital tools; interpret the data and communicate the results (AC9M4ST03)