
Back to resource library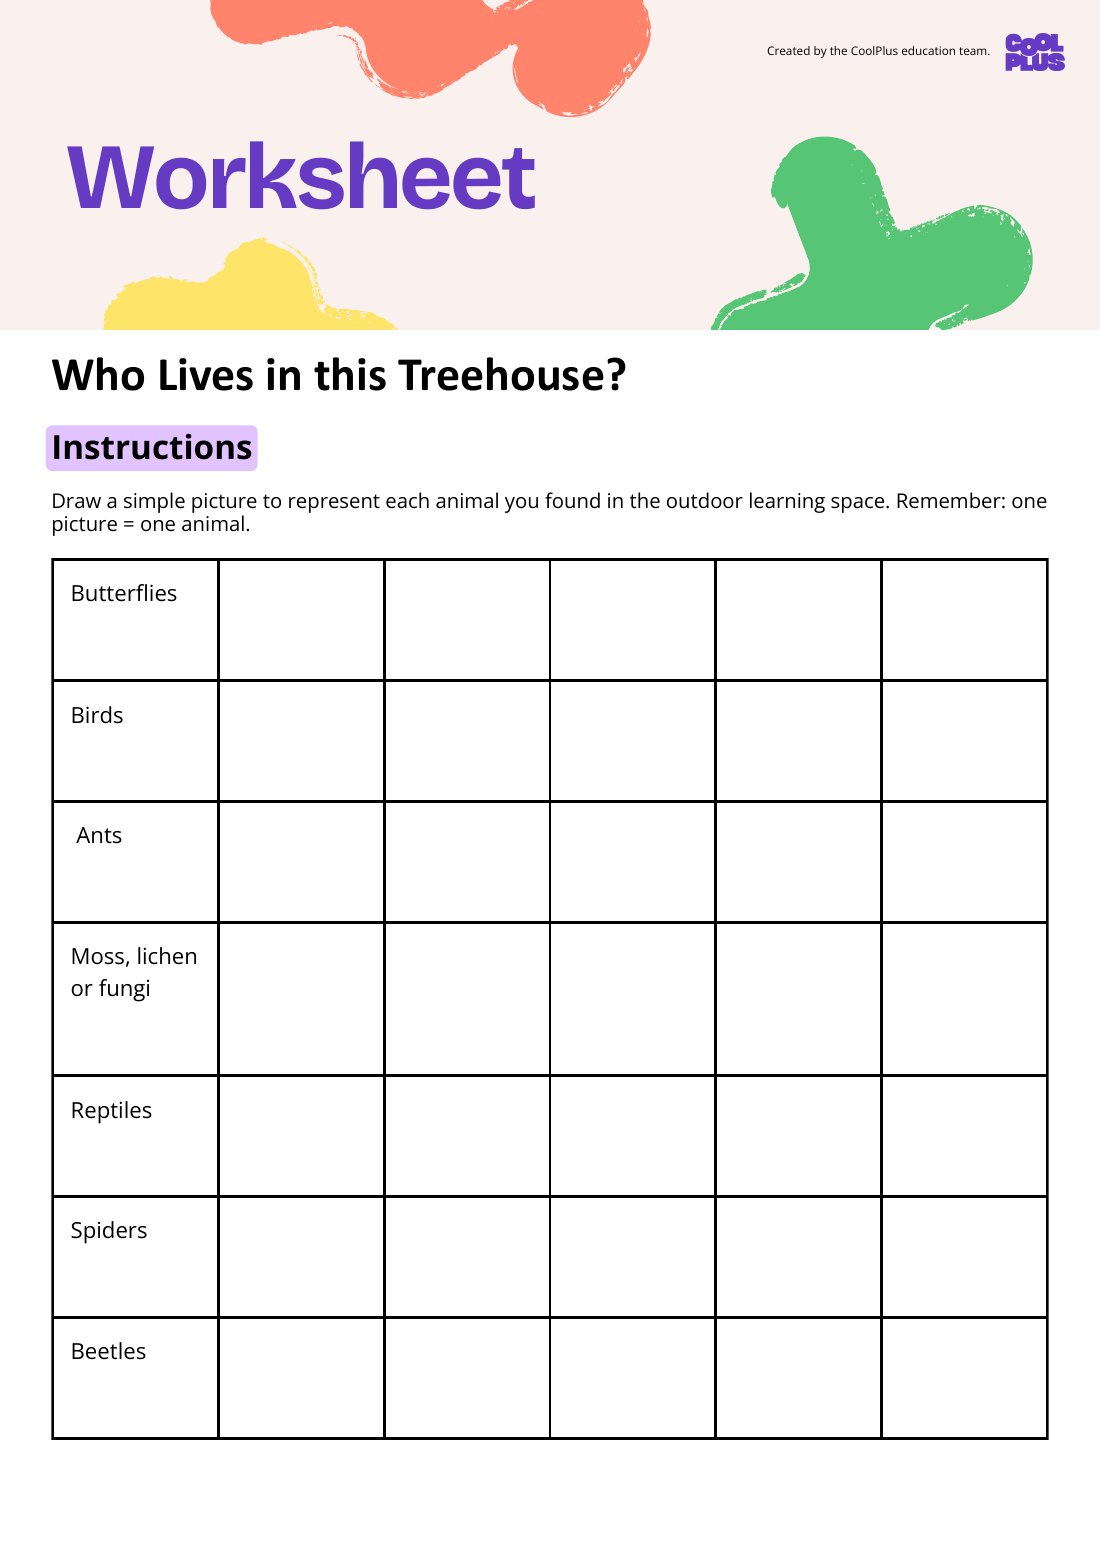
Showing first page only

Designed by
The Team from CoolPlus
Worksheet
Who lives in this Treehouse? Worksheet
Mathematics · Worksheet
Year 2BiodiversityData
This Year 2 Mathematics worksheet helps students create and interpret data displays like tally charts and picture graphs. Explore treehouse habitats, collect data on living things, and discuss display effectiveness. Perfect for understanding data representation and environmental observation.
Curriculum link
create different graphical representations of data using software where appropriate; compare the different representations, identify and describe common and distinctive features in response to questions (AC9M2ST02)